Technology
What Happens in an Internet Minute in 2019?
During an average workday, a single minute might seem negligible.
If you’re lucky, a minute might buy you enough time to write a quick email, grab a coffee from the break room, or make small talk with a coworker.
But in other situations, a minute can also be quite extraordinary. Imagine being a quarterback in the Superbowl in overtime, or finding yourself in a life-and-death situation in which every second counts towards the outcome.
Visualizing an Internet Minute
When it comes to gauging the epic scale of the internet, it would seem that each minute leans closer to the extraordinary side of the spectrum.
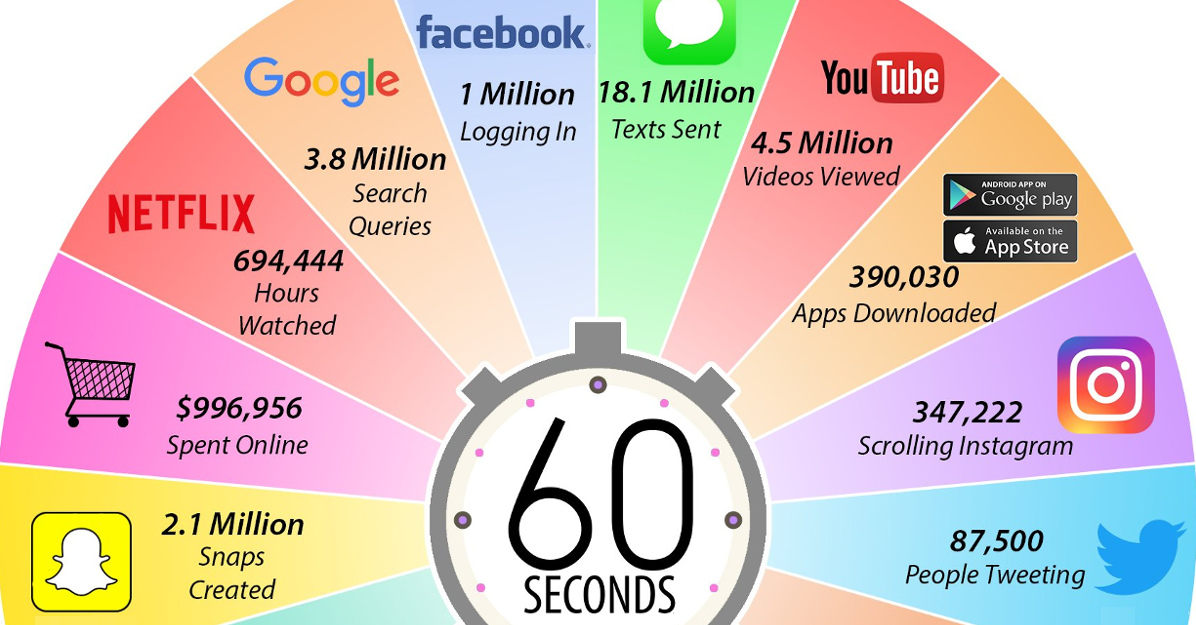
Today’s infographic from @LoriLewis and @OfficiallyChadd aggregates the online activity of billions of people globally, to see what an internet minute looks like.
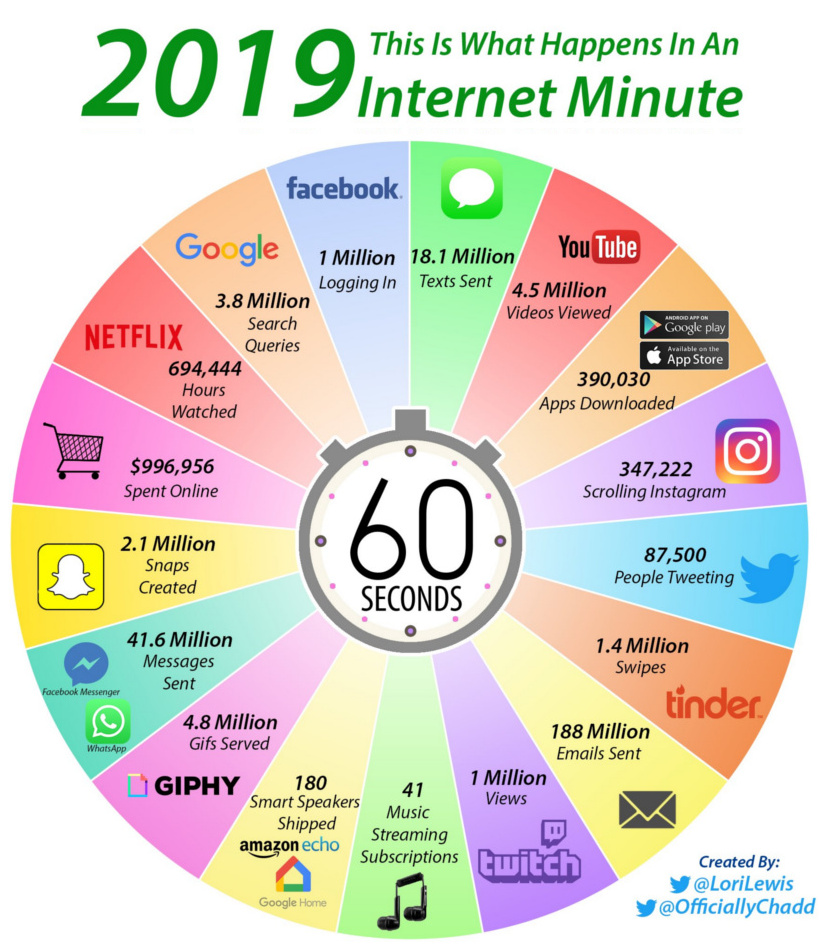
How is it possible that 188 millions of emails are sent every minute? How does Google process 3.8 million search queries in such a short span of time?
Simply put, the number of actions packed into just 60 seconds is extraordinary.
A Side-by-Side Comparison
The internet is incredibly dynamic, which means there are always new and interesting segments that are emerging out of the internet’s ether.
To get a sense of this, take a look at the comparison of last year’s version of this graphic with the more recent entry:
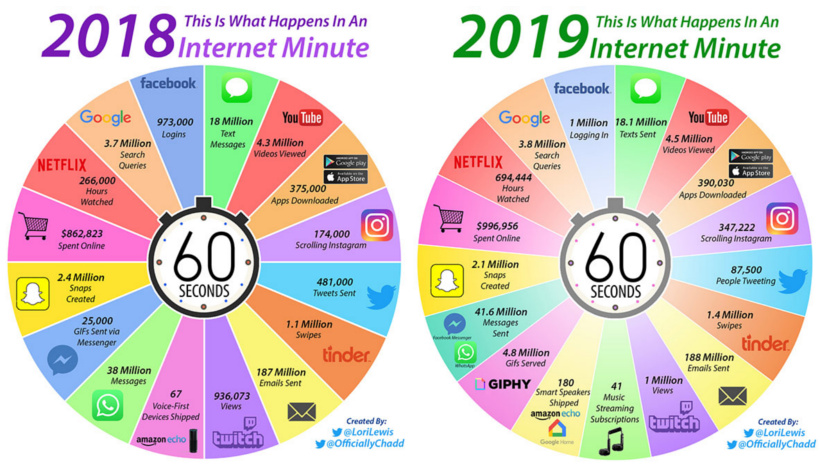
Platforms such as Instagram and Netflix continue to grow at a blistering pace, while new categories such as smart speakers are quickly building a strong foundation for the future.
Last year, for example, only 67 voice-first devices were being shipped per minute – and in 2019, there are now 180 smart speakers being shipped in the same window of time.
What will this look like in 2020?
Going Sideways or Backwards
Interestingly, even as more and more people gain access to the internet around the world each year, there are still parts of the web that are plateauing or even shrinking in size.
You’ll see that Facebook logins and Google searches both increased only incrementally from last year. Further, the amount of emails getting sent is also quite stagnant, likely thanks to to the rise of workplace collaboration tools such as Slack.
Snap is another story altogether. In the last year, the app saw a decrease in millions of users due to the infamous redesign that helped torpedo the app’s rising popularity.
Regardless, we’re certain that by this time next year, an internet minute will have changed significantly yet again!


Technology
Visualizing AI Patents by Country
See which countries have been granted the most AI patents each year, from 2012 to 2022.


Visualizing AI Patents by Country
This was originally posted on our Voronoi app. Download the app for free on iOS or Android and discover incredible data-driven charts from a variety of trusted sources.
This infographic shows the number of AI-related patents granted each year from 2010 to 2022 (latest data available). These figures come from the Center for Security and Emerging Technology (CSET), accessed via Stanford University’s 2024 AI Index Report.
From this data, we can see that China first overtook the U.S. in 2013. Since then, the country has seen enormous growth in the number of AI patents granted each year.
| Year | China | EU and UK | U.S. | RoW | Global Total |
|---|---|---|---|---|---|
| 2010 | 307 | 137 | 984 | 571 | 1,999 |
| 2011 | 516 | 129 | 980 | 581 | 2,206 |
| 2012 | 926 | 112 | 950 | 660 | 2,648 |
| 2013 | 1,035 | 91 | 970 | 627 | 2,723 |
| 2014 | 1,278 | 97 | 1,078 | 667 | 3,120 |
| 2015 | 1,721 | 110 | 1,135 | 539 | 3,505 |
| 2016 | 1,621 | 128 | 1,298 | 714 | 3,761 |
| 2017 | 2,428 | 144 | 1,489 | 1,075 | 5,136 |
| 2018 | 4,741 | 155 | 1,674 | 1,574 | 8,144 |
| 2019 | 9,530 | 322 | 3,211 | 2,720 | 15,783 |
| 2020 | 13,071 | 406 | 5,441 | 4,455 | 23,373 |
| 2021 | 21,907 | 623 | 8,219 | 7,519 | 38,268 |
| 2022 | 35,315 | 1,173 | 12,077 | 13,699 | 62,264 |
In 2022, China was granted more patents than every other country combined.
While this suggests that the country is very active in researching the field of artificial intelligence, it doesn’t necessarily mean that China is the farthest in terms of capability.
Key Facts About AI Patents
According to CSET, AI patents relate to mathematical relationships and algorithms, which are considered abstract ideas under patent law. They can also have different meaning, depending on where they are filed.
In the U.S., AI patenting is concentrated amongst large companies including IBM, Microsoft, and Google. On the other hand, AI patenting in China is more distributed across government organizations, universities, and tech firms (e.g. Tencent).
In terms of focus area, China’s patents are typically related to computer vision, a field of AI that enables computers and systems to interpret visual data and inputs. Meanwhile America’s efforts are more evenly distributed across research fields.
Learn More About AI From Visual Capitalist
If you want to see more data visualizations on artificial intelligence, check out this graphic that shows which job departments will be impacted by AI the most.

-

 Markets1 week ago
U.S. Debt Interest Payments Reach $1 Trillion
-

 Markets2 weeks ago
Ranked: The Most Valuable Housing Markets in America
-

 Money2 weeks ago
Which States Have the Highest Minimum Wage in America?
-

 AI2 weeks ago
Ranked: Semiconductor Companies by Industry Revenue Share
-

 Markets2 weeks ago
Ranked: The World’s Top Flight Routes, by Revenue
-

 Countries2 weeks ago
Population Projections: The World’s 6 Largest Countries in 2075
-

 Markets2 weeks ago
The Top 10 States by Real GDP Growth in 2023
-

 Money2 weeks ago
The Smallest Gender Wage Gaps in OECD Countries